STATS // Nova Scotia Interprovincial Trade (2018)
The trade data in the economic accounts represent provincial total and net expenditures in interprovincial (intP) and international (intN) markets. There are important differences in the characteristics of international and interprovincial trade. In this note, the focus is on interprovincial (intP) trade.
Several components of interprovincial trade are considered separately and in combination. These include exports (E), imports (I), goods (G), and services (S). Total interprovincial trade is the sum of interprovincial imports and exports of both goods and services. It measures the significance of interprovincial markets relative to international and domestic (within province) markets as the destination for the province’s output.

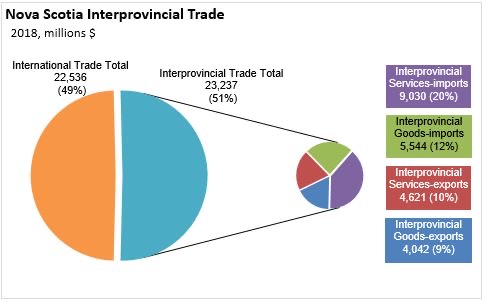
Total interprovincial trade is comprised of four components. In 2018, in order by value, they are:
- Interprovincial Imports of Services: $9.030 billion
- Interprovincial Imports of Goods: $5.544 billion
- Interprovincial Exports of Services: $4.621 billion
- Interprovincial Exports of Goods: $4.042 billion
In total, Nova Scotia’s interprovincial trade with the rest of Canada amounts to $23.237 billion.
By commodity, services are the larger share of Nova Scotia’s interprovincial trade
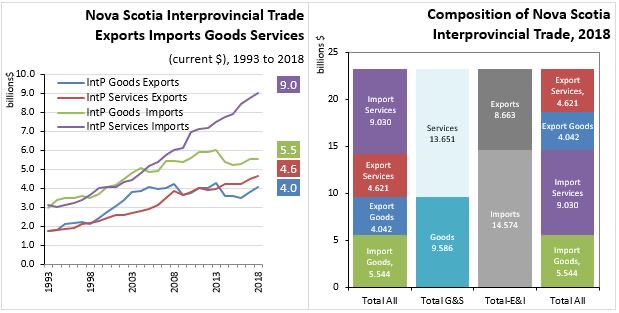
- Interprovincial Exports and Imports of Services amount to $13.7 billion (62.7% of total interprovincial trade)
- Interprovincial Exports and Imports of Goods were valued at $9.6 billion (41.3% of total international trade)
In its trade with the rest of Canada, Nova Scotia imported $5.911 billion more than it exported:
- Interprovincial Imports of Goods and Services amounted to $14.6 billion (62.7% of total interprovincial trade)
- International Exports of Goods and Services amounted to $8.7 billion (37.3% of total interprovincial trade)

INTERPROVINCIAL TRADE GROWTH
Between 2017 and 2018, the value of Nova Scotia’s GDP increased 3.3% to $44.4 billion. Nova Scotia’s interprovincial goods exports increased faster than nominal GDP on a year-over-year basis, but growth in both interprovincial services imports and services exports were slower. Interprovincial imports of goods to Nova Scotia declined last year.
- Interprovincial Exports of Goods increased 6.0%.
- Interprovincial Imports of Services increased 3.2%.
- Interprovincial Exports of Services increased 2.5%.
- Interprovincial Imports of Goods decreased 0.2%
Between 2010 to 2018, Nova Scotia’s nominal GDP grew at a Compound Annual Growth Rate of 2.3 per cent per year.
- Interprovincial Imports of Services increased 3.3% per year
- Interprovincial Exports of Services increased 2.5% per year
- Interprovincial Exports of Goods increased 0.9% per year
- Interprovincial Imports of Goods decreased 0.1% per year
Nova Scotia’s interprovincial service trade (both imports and exports) increased faster than nominal GDP on a long-term basis (2010 to 2018), while goods trade grew more slowly than nominal GDP.
SOURCE: Statistics Canada Tables 36-10-0222-01
