157th CANS ANNUAL GENERAL MEETING
HOW DID WE DO?
Attendees are encouraged to provide their feedback on CANS 157th AGM by clicking
HERE and completing the delegate feedback survey.
The Construction Association of Nova Scotia’s 2019 Annual General Meeting, held on October 4-6, 2019 at the Oak Island Resort & Conference Centre in Western Shore, NS was a big success!
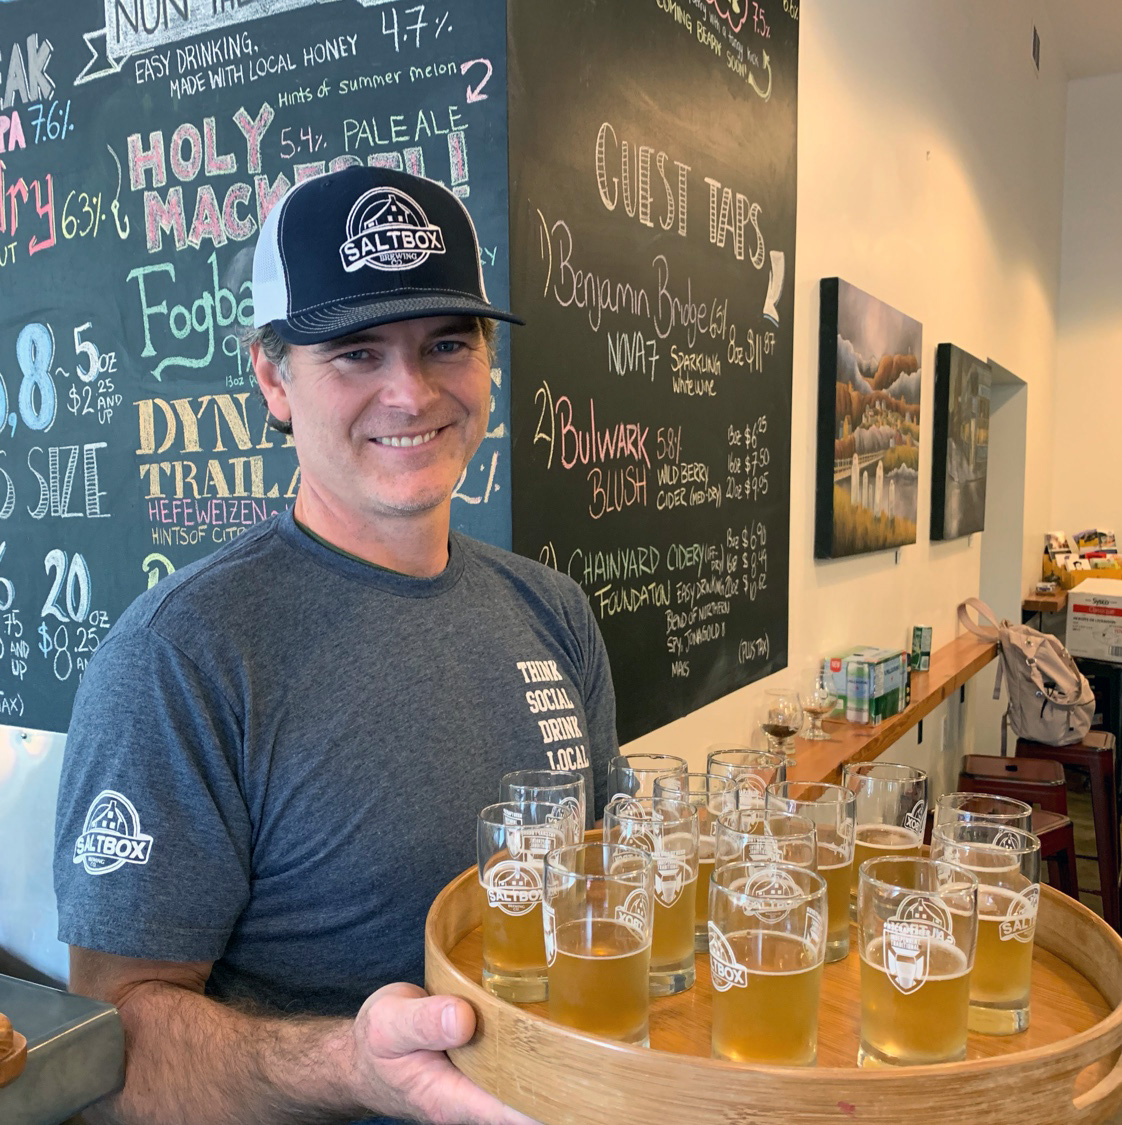
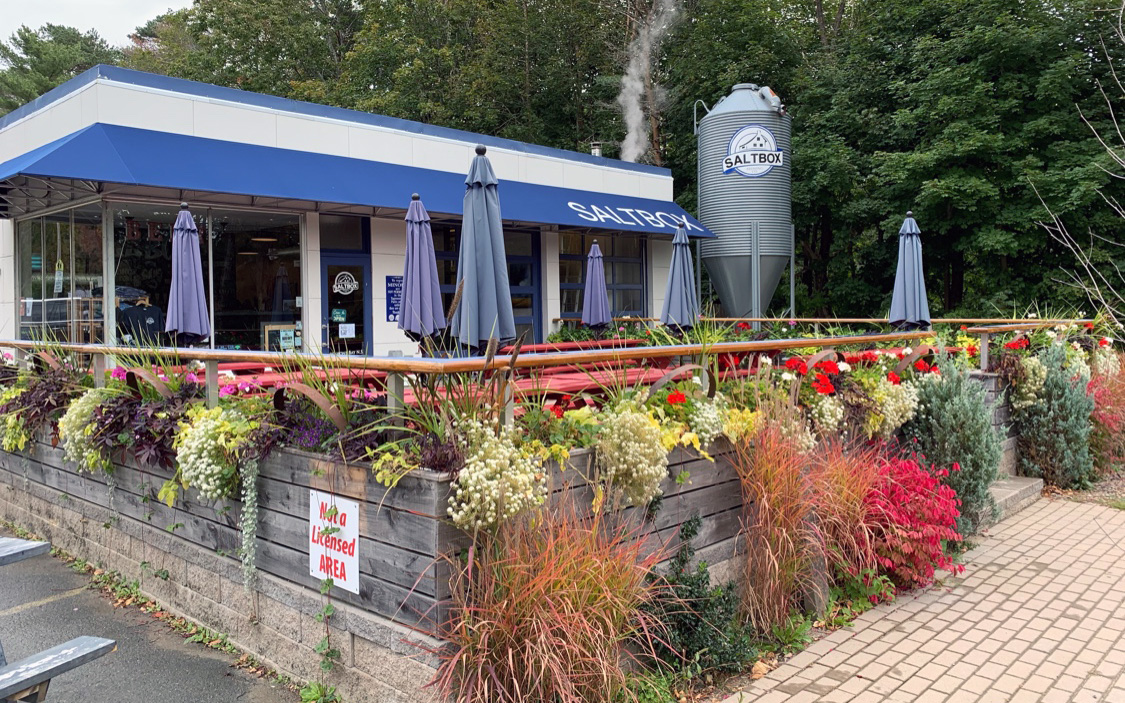
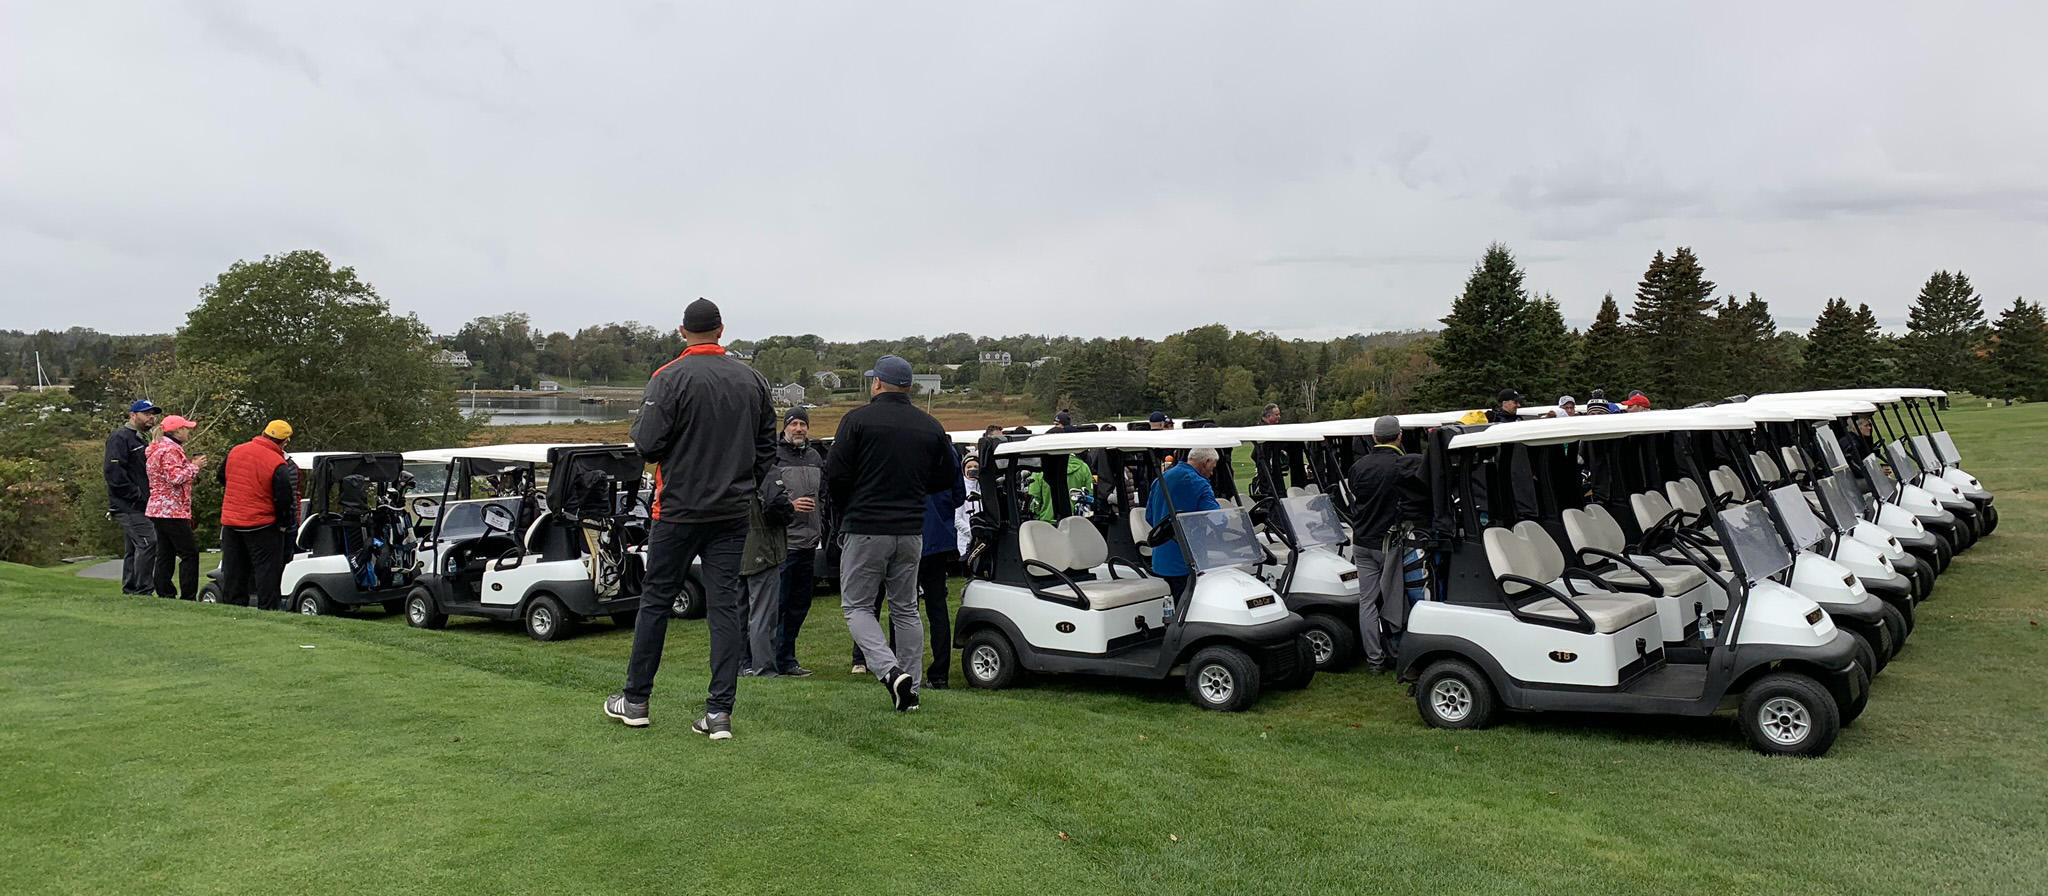
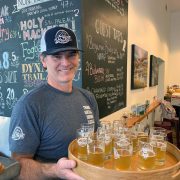
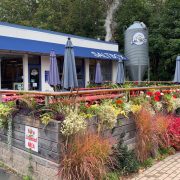
Guests kicked off the weekend with two activities: a Golf Tournament held at The Chester Golf Course and an excursion to explore Mahone Bay followed by a tour of Saltbox Brewery with lunch catered by Circa 1860 Kitchen. At the golf tournament, first place went to Shane Sinclair, Dylan Smith, Stephen Gray and Brad Payne, and second place went to Vince Moseley, Doug Brophy, Jeremy Stewart and Michael Crossley.

At Saturday’s business sessions delegates heard from Canadian Construction Association’s Chair John Bockstael and Liam Daly, Manager of Public Affairs at CCA, who presented on the past year’s events and highlighted the Strategic Plan, CCA2023. Delegates also heard from CANS Committee Chairs about the progress that CANS has made over the past twelve months, and looked toward the future with a session to kick off the creation of the next CANS Strategic Plan.
Saturday’s Awards Luncheon recognized David Wilson’s contributions to the construction industry, as the recipient of the 2019 Honourary Life Membership Award. Through the designation of Honourary Life Membership, the Construction Association of Nova Scotia honours individuals who, through their deeds and actions, have significantly contributed to the betterment of the Association, the industry, and attainment of CANS’ goals and visions.
Long-term Member Awards were also presented to member companies that have held membership with the Association for 50 years or more. The following companies received their award at the AGM: Englobe Corp., Gallagher Canada Limited, South Shore Ready Mix Limited and Truefoam Limited. The Long-term Member Award honours companies who have shown their dedication, support, and commitment to the Association throughout the years and is an achievement to be proud of.
CANS also congratulated those members who have achieved 25 years of continuous membership by presenting them with a Bowman Award. G.J. Cahill & Co. (1979) Ltd., The Guarantee Company of North America and Wickwire Holm accepted their Bowman Awards at the AGM this year.
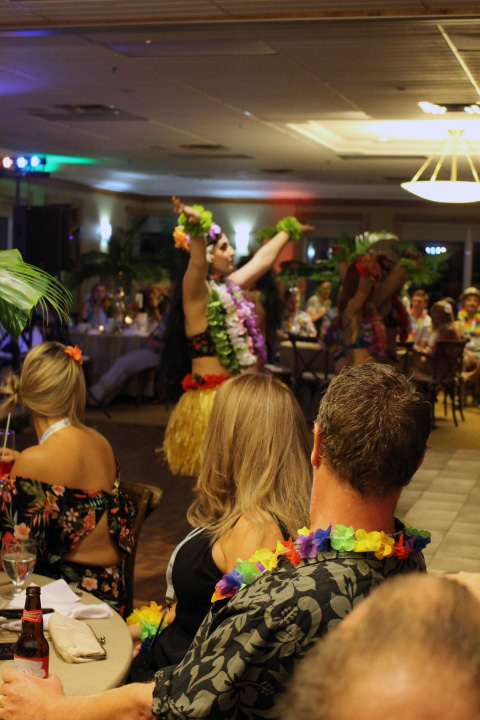
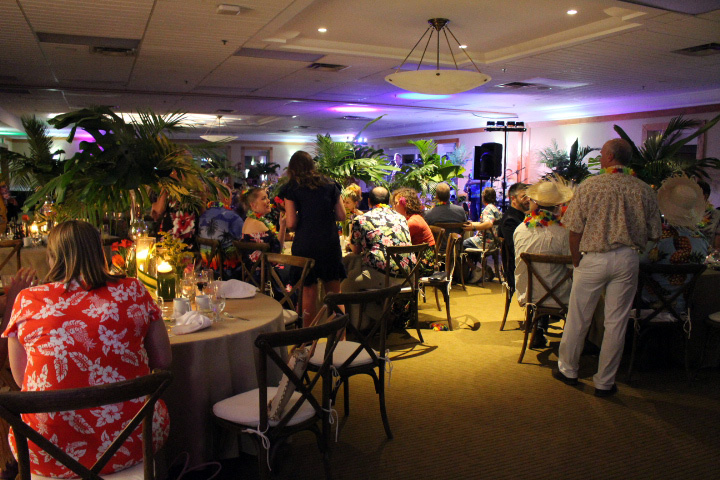
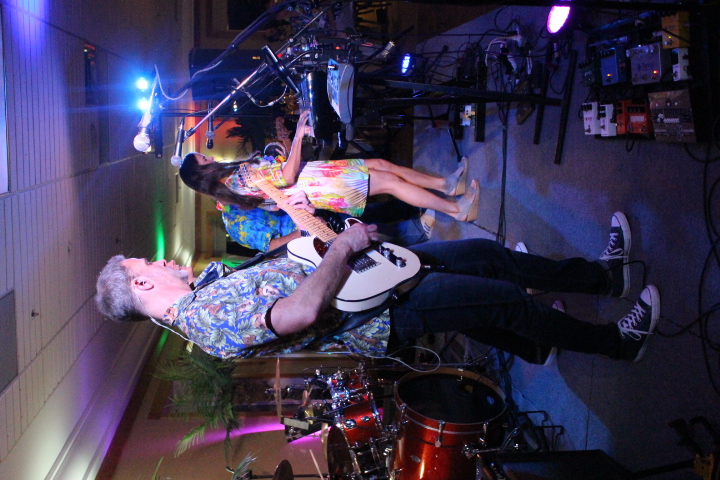
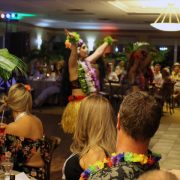
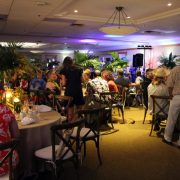
Delegates danced the night away in their Hawaiian shirts, leis and grass skirts, all ready for the Best Dressed Awards, to the musical talents of Big Fish at Saturday evening’s Hawaiian Luau!

FEEDBACK
Attendees: If you attended the 157th AGM, we would love to hear from you! Please submit feedback here: https://www.surveymonkey.com/r/AGM19Delegate
Sponsors: If you sponsored the 157th AGM, keep your eye out for the sponsor feedback survey from Natalie!
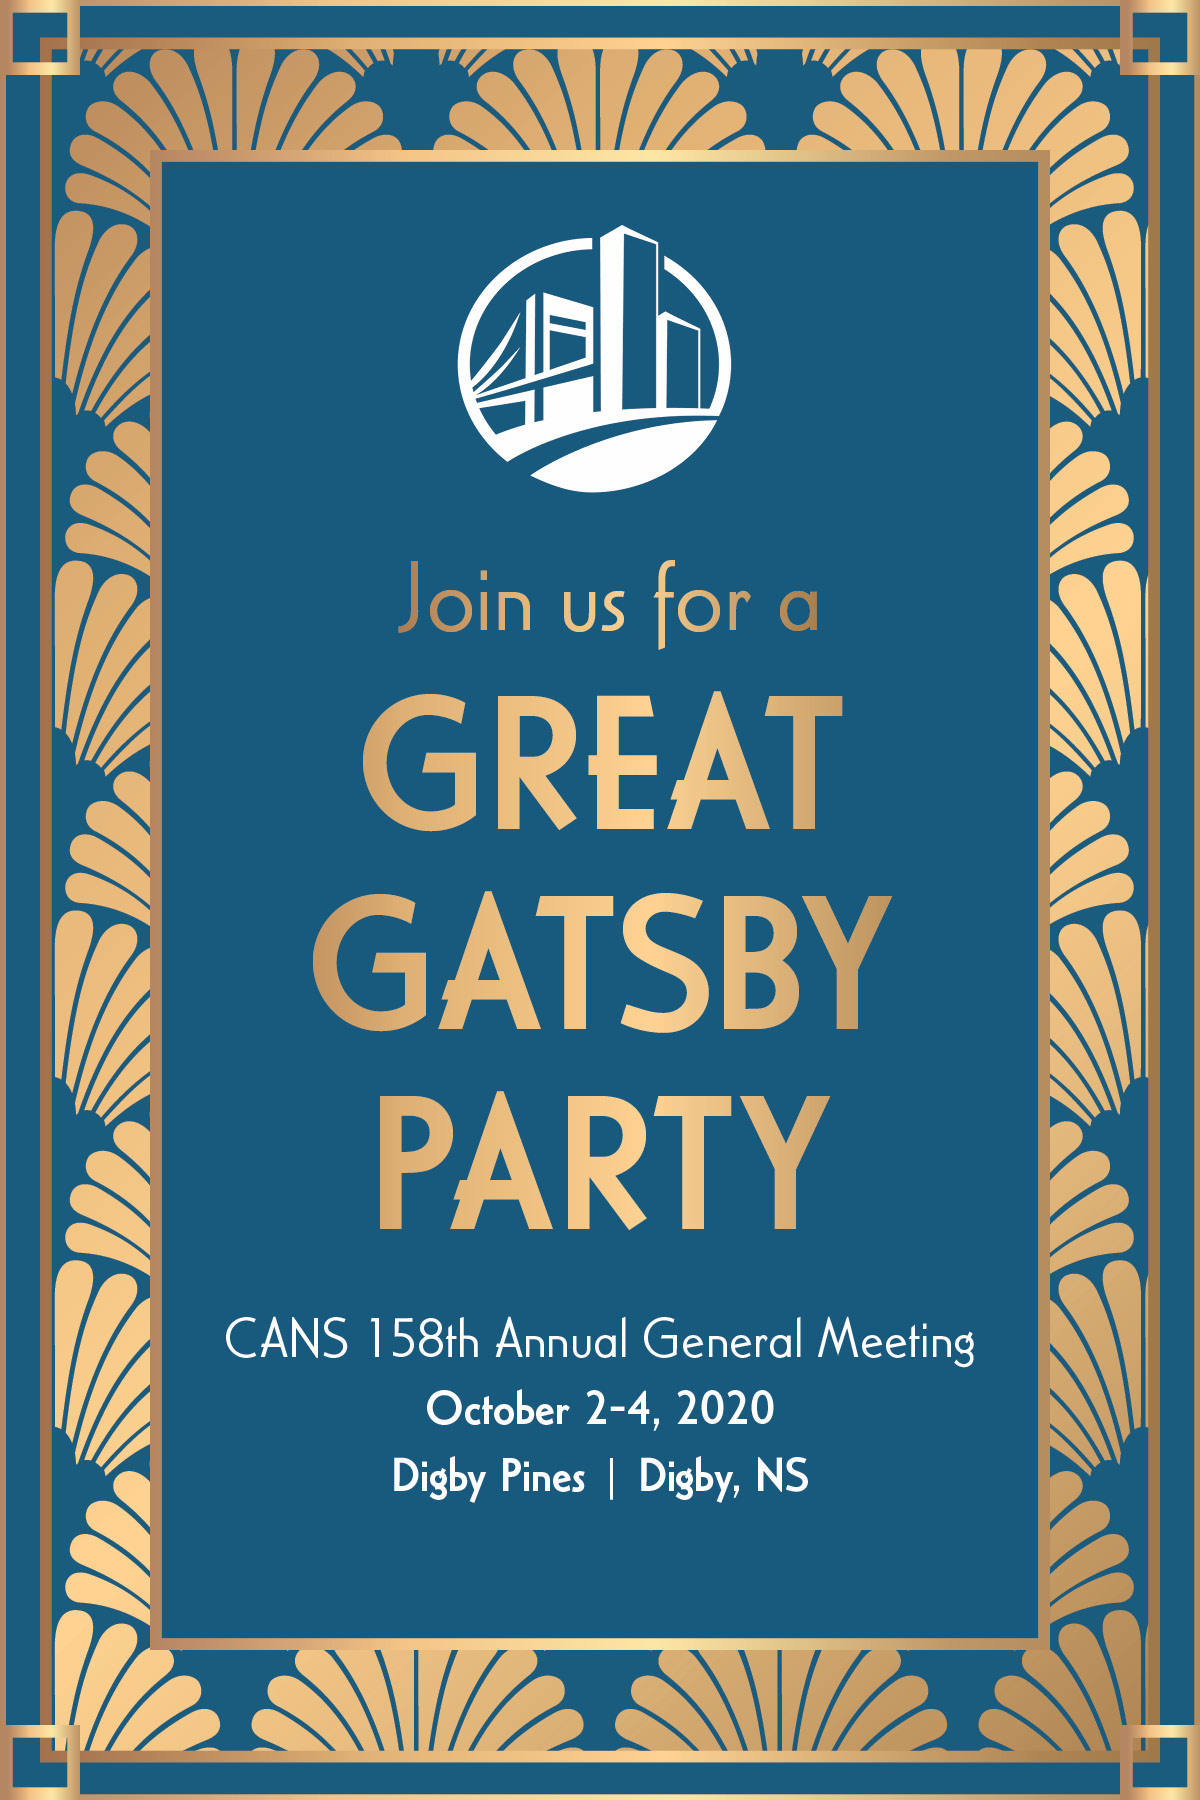
SAVE THE DATE!
CANS 158th Annual General Meeting
When: October 2-4, 2020
Where: Digby Pines Golf Resort & Spa in Digby, Nova Scotia
Theme: The Great Gatsby (Jazz, flappers, glitz, glamour, champagne and decadence)
Register NOW! Click here to register for next year’s AGM, today!
Sponsor NOW! Contact Natalie at 902.210.1720 or nbobbitt@cans.ns.ca!
2019-2020 LONG-TERM MEMBER AWARDS
CANS congratulates those members who have achieved 50 years of continuous membership by presenting them with a Long-term Award.
- Englobe Corp.
- Gallagher Canada Limited
- South Shore Ready Mix Limited
- Truefoam Limited
- V.J. Rice Concrete Ltd.
2019-2020 BOWMAN AWARDS
CANS congratulates those members who have achieved 25 years of continuous membership by presenting them with a Bowman Award.
- Able Electric 2016 Limited
- Advanced Energy Management Ltd.
- Asbestos Abatement Ltd.
- Atlantic Explosives Ltd.
- Blaine F. MacLane Excavation Ltd.
- Fundy Electric Limited
- G.J. Cahill & Co. (1979) Ltd
- John Morrison Contracting Ltd.
- R.D.L. Construction Limited
- Sansom Equipment Ltd.
- Techno Hard Surfaces Limited
- The Guarantee Company of North America
- MacPhail Construction Ltd.
- Waller Agencies Limited
- Wickwire Holm
A BIG THANKS TO ALL OF OUR AGM SPONSORS!
Level Company
Title Sponsor MARSH
App Sponsor Lindsay Construction
Diamond Sponsor Kent Building Supplies
Platinum Plus TD Banking
VIP Sponsor NSCC Foundation
Print Sponsor Halcraft Printers
Platinum AON Construction Services Group
Platinum Conrad Bros Ltd.
Platinum Nova Scotia Power
Gold AW Leil Cranes & Equipment
Gold Bird Stairs
Gold Black & McDonald
Gold BOYNECLARKE LLP
Gold Department of Labour and Advanced Education
Gold dexel
Gold Dexter Construction
Gold Iron Dog Inc.
Gold PCL Constructors Canada Inc.
Gold Pomerleau Inc.
Gold Procore Technologies
Gold SANCTON
Gold Scientext Technical Writing Ltd.
Gold Stanhope Simpson Insurance
Gold Steinhart
Gold Travelers Canada
Silver Arrow Construction Products
Silver Atlantica Contractors
Silver Battlefield Equipment Rentals
Silver BELFOR
Silver Big Bang Promotional
Silver Bird Construction
Silver CBCL Limited
Silver DORA Construction
Silver Eastern Fence
Silver Heritage Gas
Silver Kent Mobile Shelters
Silver L.E. Cruickshanks Sheet Metal Ltd.
Silver MacGregors Industrial Group
Silver Marco Group
Silver Marid Industries
Silver Meridia Recruitment Solutions
Silver Merit Nova Scotia
Silver Ocean Contractors Limited
Silver RKO Steel Ltd.
Silver The Guarantee Company of North America
Silver The Shaw Group
Silver Tirecraft
Silver Trisura Guarantee Insurance Company
Silver WCB Nova Scotia
Water Sponsor Rogers Communications Canada
Golf Hole Sponsor CANS Group Health and Wellness
Golf Hole Sponsor MacFarlands Industrial
Golf Hole Sponsor MCT Insurance a division of BrokerLink
Golf Hole Sponsor NationTek
Golf Hole Sponsor Schooley Mitchell
Golf Hole Sponsor Steinhart Distillery
157th ANNUAL GENERAL MEETING PHOTOS
Want to see what you missed out on at CANS 157th AGM? Catch up on all of our CANS Events on Flickr!
HAVE PHOTOS YOU’D LIKE TO SHARE WITH US?
Please email Alison Clack, Marketing & Communications Lead