Come Work for CANS! Job Posting – Director of Policy and Workforce Development
CANS is hiring! We are currently seeking a qualified individual to fill the position of a newly developed role, our Director of Policy and Workforce Development.

CANS is hiring! We are currently seeking a qualified individual to fill the position of a newly developed role, our Director of Policy and Workforce Development.
Through the designation of Honourary Life Membership, CANS wishes to honour individuals who, through their deeds and actions, have significantly contributed to the betterment of the Association and/or the industry and attainment of its goals and visions. Nominations are due by Friday, May 8, 2020.
For more information and to download the nomination form, click HERE. Please submit your nomination forms to Sheryl Farrington by email sfarrington@cans.ns.ca
The trade data in the economic accounts represent provincial total and net expenditures in interprovincial (intP) and international (intN) markets. There are important differences in the characteristics of international and interprovincial trade. In this note, the focus is on interprovincial (intP) trade.
Several components of interprovincial trade are considered separately and in combination. These include exports (E), imports (I), goods (G), and services (S). Total interprovincial trade is the sum of interprovincial imports and exports of both goods and services. It measures the significance of interprovincial markets relative to international and domestic (within province) markets as the destination for the province’s output.
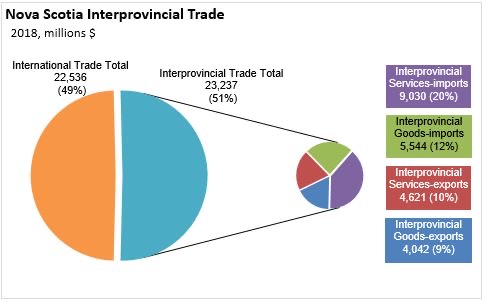
Total interprovincial trade is comprised of four components. In 2018, in order by value, they are:
In total, Nova Scotia’s interprovincial trade with the rest of Canada amounts to $23.237 billion.
By commodity, services are the larger share of Nova Scotia’s interprovincial trade
In its trade with the rest of Canada, Nova Scotia imported $5.911 billion more than it exported:
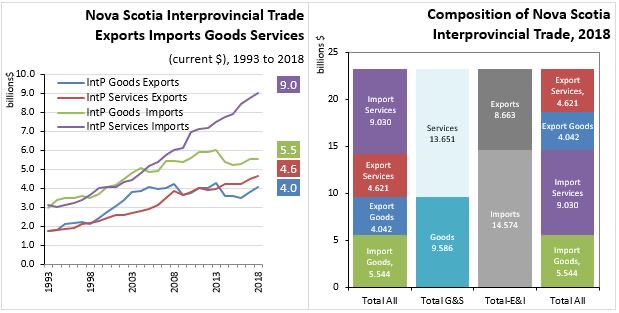
INTERPROVINCIAL TRADE GROWTH
Between 2017 and 2018, the value of Nova Scotia’s GDP increased 3.3% to $44.4 billion. Nova Scotia’s interprovincial goods exports increased faster than nominal GDP on a year-over-year basis, but growth in both interprovincial services imports and services exports were slower. Interprovincial imports of goods to Nova Scotia declined last year.
Between 2010 to 2018, Nova Scotia’s nominal GDP grew at a Compound Annual Growth Rate of 2.3 per cent per year.
Nova Scotia’s interprovincial service trade (both imports and exports) increased faster than nominal GDP on a long-term basis (2010 to 2018), while goods trade grew more slowly than nominal GDP.
SOURCE: Statistics Canada Tables 36-10-0222-01
Our colleagues at the Canadian Construction Association (CCA) have issued the following press release to voice their displeasure with the recent decision by the Supreme Court of Canada to reject the appeal brought forward by J. Cote & Son Excavating. This ruling has serious implications for contractors as it effectively upholds the use of reprisal clauses in tender documents.
OTTAWA, December 16, 2019 – The Canadian Construction Association (CCA) is displeased to learn that the Supreme Court of Canada has dismissed an appeal brought forward by contractor, J. Cote & Son Excavating.
Last week’s decision effectively upholds the use of “reprisal clauses” in tender documents. The clause used by the City of Burnaby against J. Cote & Son Excavating stated that the city would not accept tenders from any party that is, or has been within the last two years, involved in legal proceedings initiated against Burnaby arising out of a contract for works or services.
“The clause effectively forces consultants or contractors who may have a dispute with the city to choose between pursuing their legal rights and bidding on city contracts for the next two years,” said Mary Van Buren, CCA president.
This ruling has serious implications for contractors; it condones placing contractors on a two-year blacklist that bans them from bidding on city projects.
“The inclusion of these types of clauses in contracts essentially allows contractors to be financially punished for exercising their legal rights,” explains Van Buren. “The result is contractors are deterred from accessing the courts to enforce their legal rights because they fear being banned from future participation in projects.”
The decision by the Supreme Court of Canada effectively means that there is no constitutional barrier to municipalities using reprisal clauses. CCA will continue to closely monitor any developments as the association believes this case ruling could have major implications for the construction industry in all of Canada.
If you have any questions or comments about this release, please contact CCA’s vice-president of public affairs, Rodrigue Gilbert, at rgilbert@cca-acc.com or 613-236-9455, ext. 432.
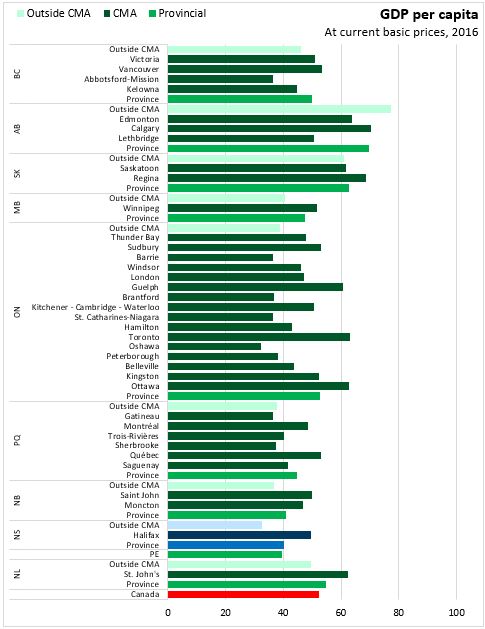
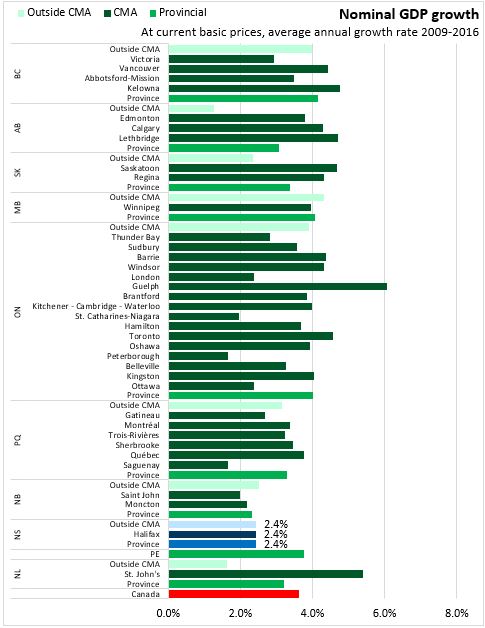
Today, Statistics Canada released Gross Domestic Product (GDP) data for Canada’s Census Metropolitan Areas (CMAs) and the areas outside of CMAs for 2016 and revised previous estimates for 2009-2015. All data are benchmarked to provincial nominal GDP at basic prices.
These results continue to show that just over half of Canada’s GDP is generated in the six CMAs: Toronto, Montréal, Vancouver, Calgary, Edmonton and Ottawa–Gatineau. Like population, economic activities primarily focus in cities. In 2016, CMAs accounted for 71.1 per cent of Canada’s population and generated about 74.4 per cent of Canadian GDP. In Nova Scotia, Halifax accounted for 43.9 per cent of provincial population and 54.4 per cent of provincial GDP.
Overall in 2016, GDP per capita in reported CMAs was $54,683. Halifax’s GDP per capita was $49,638. Across Canada, the largest GDP per capita among CMAs is reported in Calgary, Regina, Edmonton and Toronto. However, results may be sensitive to fluctuations in commodity prices. The lowest GDP per capita among reported CMAs was observed in Oshawa ($32,259).
Outside CMAs, GDP per capita was $46,217. The highest non-CMA GDP per capita was observed in Alberta at $77,383 (higher than CMA GDP per capita) while the lowest was reported for Nova Scotia ($32,613). Per capita GDP outside Canada’s reported CMAs averaged 85.6 per cent of CMA GDP per capita.
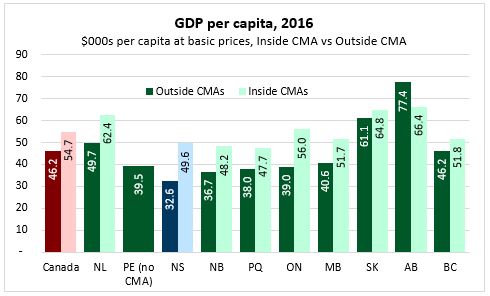
From 2009-2016, GDP growth has averaged 3.9 per cent inside CMAs and 2.9 per cent outside CMAs. Halifax’s GDP grew by 2.4 per cent on average over this period, the same pace of growth for Nova Scotia outside Halifax. The fastest growing economies over this period were observed in Guelph, St. John’s, Kelowna and Lethbridge. GDP growth outside CMAs was faster in Manitoba, Ontario and British Columbia.
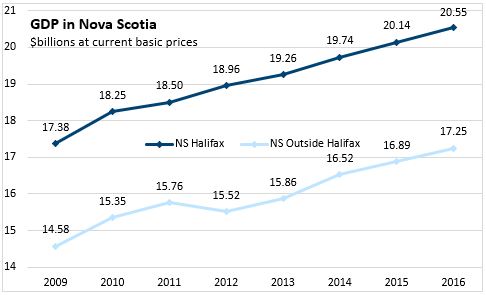
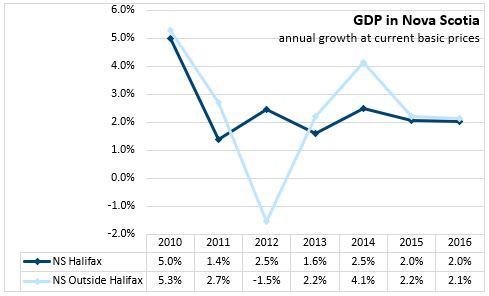
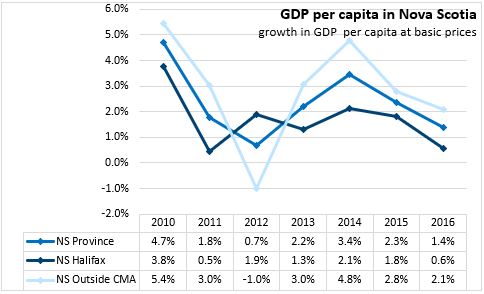
Nova Scotia’s GDP in 2016 was $37.80 billion, of which $20.55 billion was generated in Halifax and $17.25 billion was generated outside of Halifax. GDP has been rising in both Halifax and the rest of the province, but growth outside the city has been faster for all years except 2012, when two paper mills were shuttered.
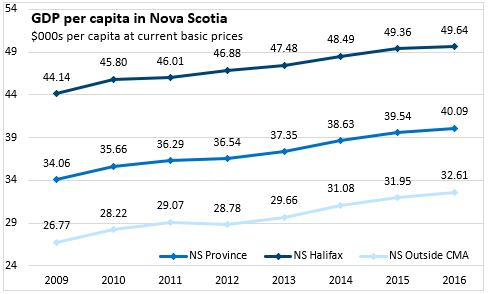
On a per capita basis, GDP in Halifax remains significantly higher than in the rest of Nova Scotia. However, except for 2012, per capita GDP growth outside Halifax has been faster than inside Halifax, narrowing the gap in GDP per capita between urban and rural areas of the province.
Source: Statistics Canada. Table 36-10-0468-01 Gross domestic product (GDP) at basic prices, by census metropolitan area (CMA) (x 1,000,000); Table 17-10-0135-01 Population estimates, July 1, by census metropolitan area and census agglomeration, 2016 boundaries; Table 17-10-0005-01 Population estimates on July 1st, by age and sex
Did you know that CCDC 11- Contractor’s Qualification Statement was just updated? Effective December 6, 2019, CCDC 11 – 2019 will be in circulation.
Recognizing that our membership is located throughout Nova Scotia and beyond, the CANS Member Mixer program takes us from one end of the province to the other. Join us on November 26, in Sydney, NS!

We have been following this project! Have you? See our Pipeline connection PL17-0253NS about the Halifax Transition House Association – Bryony House and view the Open Tender NS19-2272.

With voting day fast approaching on October 21, Canadian Construction Association (CCA) is renewing their call, asking you to join the campaign, #Construction4CDNs, by clicking on the “take action” button below and sending a letter to your election candidates.
Now is the time to stand up for construction and make sure action is taken on the issues facing our industry as we work to build a better Canada.
CCA’s campaign #Construction4CDNs, and its associated website construction4cdns.ca, champion four main issues of national importance for the construction industry. They are:
Please visit the website above to read more about these issues and what we are asking the government to do to address our concerns.
CCA is grateful to all those who have participated in this campaign to date and ask you to continue spreading the word to those who may not yet have had the opportunity. CCA also encourages those whose homes and places of work are in separate ridings to send two letters to further extend our reach.